6 Minutes
JavaScript Breakpoints Explained: Debug Faster Without Guessing
Fix Bugs Faster! Log Collection Made Easy
A JavaScript breakpoint is a pause point in code execution.
Breakpoints are one of the most crucial tools available to us when debugging.
Simply put, they enable us to pause our program in real time and inspect a particular chunk of code. We may have suspicions that a particular line is causing our app to crash, or simply want to check part of the call stack. Breakpoints give us this flexibility.
In JavaScript’s browser-based environment, a single error can bring down the entire UI, so breakpoints are doubly important. This post will give you a zero-to-pro knowledge of the concept, covering:
And if you want a broader guide to JavaScript debugging in Chrome, we’ve got a whole post on that too.
How to set JavaScript breakpoints in Chrome
Line-of-code breakpoints
Chrome gives you all the tools you need to set up single-line breakpoints. All you’ve got to do is:
- Click the
Sourcestab. - Browse the source file from the
File navigationsection. - Go to the line of code in the
Code Editorsection on the right. - Click on the line number column to set a breakpoint on a line.

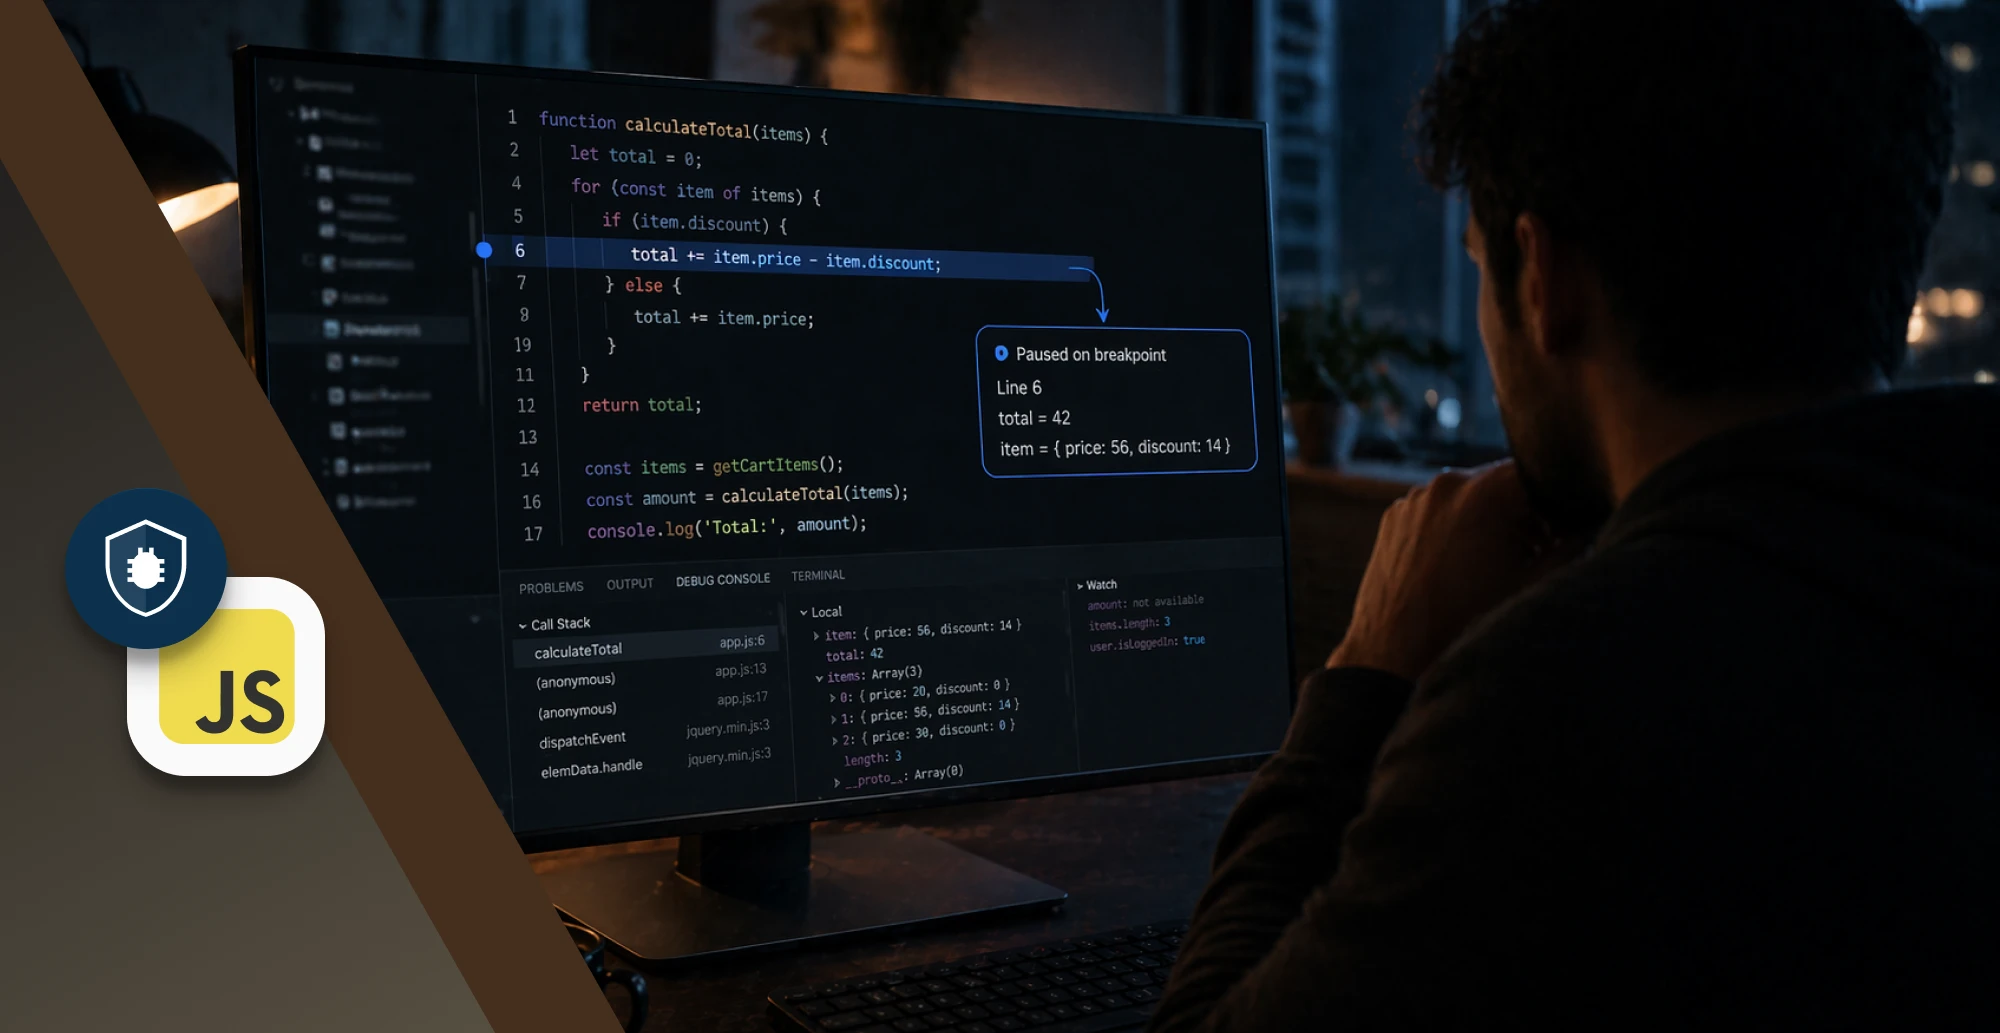
Here we have set a breakpoint at the line number 6. The code execution will pause right here.
Pro tip: Use this when you want to pause execution early and narrow down where the bug is introduced. You can also set up multiple line-of-code breakpoints and investigate.
Conditional breakpoints
Conditional breakpoints allow us to set conditions which will determine whether the debugger breaks or skips. To set a conditional breakpoint:
- Click the
Sourcestab. - Browse the source file from the file navigation section.
- Go to the line of the code in the code editor section on the right.
- Right-click on the line number and select the
Add conditional breakpointoption.

- A dialog box appears below the line of code. Start typing the condition. As we type, we see the autocomplete option suggesting we pick up a condition.

- Press
Enterto activate the breakpoint. An orange icon should appear on top of the line number column.

The code execution will be paused whenever the function print() is invoked with the name Joe.
Event listener breakpoints
This bit’s crucial.
An event listener waits for an event to happen, then executes its handler. Other languages have listeners as well, but they’re often provided by frameworks rather than the language itself. With JavaScript, they’re built into the language environment.
We can set breakpoints on these event listeners like so:
- Click the
Sourcestab. - Expand the
Event Listener Breakpointspane in thedebugger section. - Select the list of event listeners from the category list to set breakpoints. We have a button click event in our application. We will be looking to select the
clickcheckbox under themouseoption.

Tips: Use this when you want to pause the event listener code that runs after an event is fired.
DOM breakpoints
Another huge advantage of DevTools is the power it offers with DOM inspection and debugging. In fact, we can set breakpoints to pause code execution whenever something is added, removed or changed in the DOM.
To set breakpoints on the DOM, all we’ve got to do is:
- Click the
Elementstab. - Go to the element that we want to set the breakpoint on.
- Right-click on the element to get a context menu. Then, select
Break onand choose one of:Subtree modifications,Attribute modifications, orNode removal.
As shown below, we are setting a breakpoint on the DOM change of the output DIV, with a condition of Subtree modifications. We are aware that a greeting message will be added into the output DIV, and the subtree will be modified to trigger the breakpoint.

Tip: Use this when you suspect a DOM change is causing the bug. The related JavaScript code execution will be paused automatically when it breaks on the DOM change.
When to use each type of JavaScript breakpoint
Different breakpoint types exist because not all bugs surface the same way.
If we could give you one bit of advice, it would be: use each one clearly and intentionally. This table should help.
| Breakpoint type | When to use it |
|---|---|
| Line-of-code breakpoints | Pause execution at a specific line to inspect how code reaches that point. |
| Conditional breakpoints | Code runs many times and you only want to pause for specific values or states. |
| Event listener breakpoints | Code is triggered by user interaction and the execution path is unclear. |
| DOM breakpoints | The UI changes unexpectedly and you need to find which code caused the change. |
Choosing the right breakpoint type often matters more than adding more breakpoints.
Managing multiple breakpoints in Chrome
As projects grow, multiple breakpoints are often active at the same time.
Chrome DevTools provides a Breakpoints panel in the Sources tab to help us keep track. From there, we can:
- See all active breakpoints.
- Enable or disable individual breakpoints.
- Remove breakpoints when they are no longer needed.
This makes it easy to test different execution paths without re-adding breakpoints.
Disable & remove breakpoints
To disable all the breakpoints at once, we can click on the Deactivate Breakpoints button (it is circled below.)

Note that the above method doesn’t remove the breakpoints. It simply deactivates them for the duration we require. To activate the breakpoints, just click the same button again.
We can remove one or more breakpoints from the Breakpoints panel by unchecking the checkboxes. We can remove all the breakpoints permanently by doing a right-click and selecting the Remove all breakpoints option.

Common mistakes when using JavaScript breakpoints
As we suggested at the top, breakpoints can be quite tricky if you’re new to JS’s browser-based environment. Here are a couple of the mistakes we’ve made at Bugfender – so you don’t have to make them yourself.
1. Placing breakpoints too late
If a breakpoint is placed after a value changes, the cause is already missed.
It is often better to pause:
- Before a mutation
- Before a conditional branch
- Before a function returns
2. Ignoring the call stack
The call stack explains how execution reached the breakpoint.
Skipping it often leads to fixing symptoms instead of the root cause (as many devs will tell you from bitter experience!)
How JavaScript breakpoints fit into a debugging workflow
Breakpoints are just one piece of a larger debugging process. They work best when combined with:
- A clear reproduction path.
- Understanding of Chrome DevTools.
- Other debugging techniques when issues are not reproducible locally.
For the full workflow, see https://bugfender.com/blog/javascript-debugging/
For a broader overview of Chrome tooling, see https://bugfender.com/blog/chrome-developer-tools/
This article focuses specifically on how breakpoints work and how to set them.
Summary
To recap (and hopefully you’ve got this by now): JavaScript breakpoints let us pause execution exactly when something matters.
Chrome DevTools supports multiple breakpoint types:
- Line-of-code
- Conditional
- Event listener
- DOM
And each one exists to stop execution at a different kind of trigger.
Used correctly, breakpoints make JavaScript behavior visible instead of speculative. We hope you’ve got all the knowledge you need to start using breakpoints correctly. And if you’ve got any questions, just reach out!
Expect The Unexpected!
Debug Faster With Bugfender

Aleix Ventayol
Aleix Ventayol is CEO and co-founder of Bugfender, with 20 years' experience building apps and solutions for clients like AVG, Qustodio, Primavera Sound and Levi's. As a former CTO and full-stack developer, Aleix is passionate about building tools that solve the real problems of app development and help teams build better software.